

A chartplotter is often the first item people add to their new motor boat, sometimes at the expense of physical charts. Jon Mendez explains how to set one up properly.
Personally, I would not go to sea in an unfamiliar area without a printed chart. However, the reality is that many owners use some form of chartplotter as their primary form of navigation. Used well they are an excellent aid to navigation. But straight from the manufacturer they are just a means of establishing your boat’s current position. How that is displayed and how you use that information is what keeps your boat safe.
So any boat I step on, I go through the following routine to ensure I understand what is being displayed and how it relates to me. The first step is to establish the dates of any charts loaded on it. On start-up most plotters display a warning “not to use this as your primary form of navigation”, which most of us bypass or don’t read in full. However, there is often a tab to “read more” that should give the chart’s date. This indicates how accurately you can rely on the information displayed.
Next, I go to the setup menu — some are easy to follow, others hide things in different layers and places so be prepared to explore. I then check the position shown to verify visually that I am where it shows me to be. If I can find a signal strength indicator, I will check that too. You should be looking for a low HDOP of close to 1. This means that it’s receiving a position and telling you accurately where you are.
Next up is system datum. Are the charts and plotter displaying position in the same format — usually WGS 84? I like the chart displayed in ‘North up’, so the image looks the same as a printed chart, especially if I am somewhere unknown. Other people prefer a ‘Head up’ view, where the chart moves around with your direction of travel, much like most sat navs in cars. It’s a personal preference.
Then I check the units being used and ensure it’s in local time so that any tidal information is correct and not for another time zone. By the same token if it’s in an area with chart depths in metres, then I want the plotter to display the same. I use nautical miles and knots for distance and speed and if the plotter has a sonar, then metres for depth. I like any bearings to be shown in True, again so they match the chart.
Lastly, I look at the cartography — what is shown and how. Most units allow you to choose how much detail is available and give greater detail as you zoom in, unlike a physical chart which only has what is printed on it. It’s very easy to miss important information by being zoomed out too far. On most plotters, you can also set the colours of different water depths.
I like the chart to display deep areas in white and shallow — usually below 5m — in blue. If there is the option to show information alongside the chart itself I choose the following: position in latitude and longitude, course over the ground (COG), speed over the ground (SOG) and depth. The crucial part is not to believe any of it without checking first. That means visual checks of your surroundings using the compass to see that the COG is roughly correct and the buoyage matches what the screen displays.
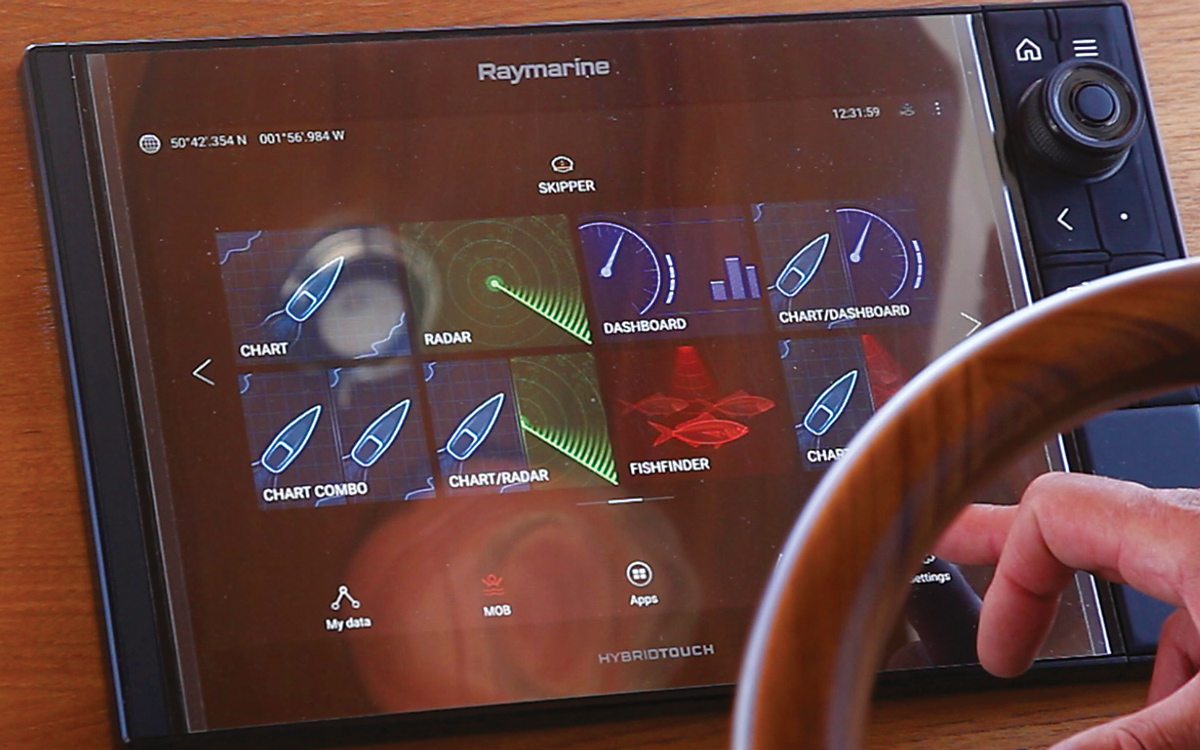
This is the setup screen of the plotter on our test boat — a Hybrid Touch version that pings up once you turn it on. I have my finger on the settings button to check and adjust the key settings.
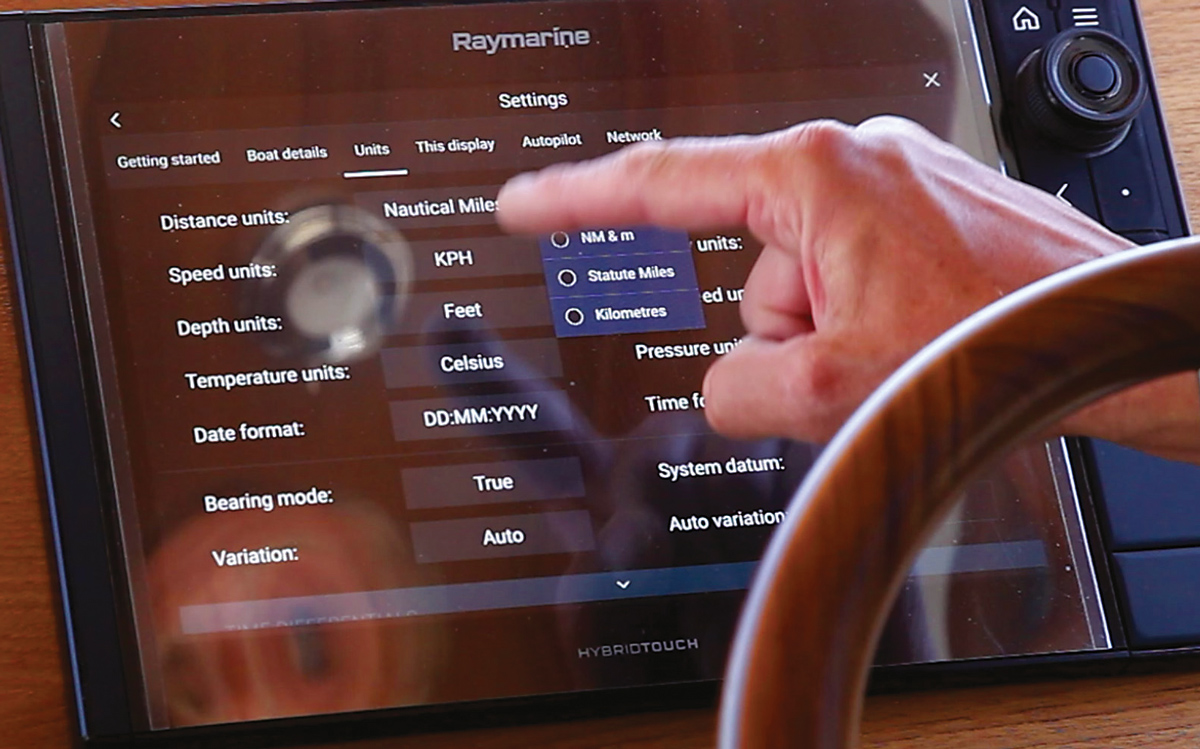
The settings page (pictured above) allows you to configure units such as time, distance and speed to your own preferences. When the plotter is fresh out of the box it normally comes programmed with land-based units, which will need to be adjusted to nautical ones.
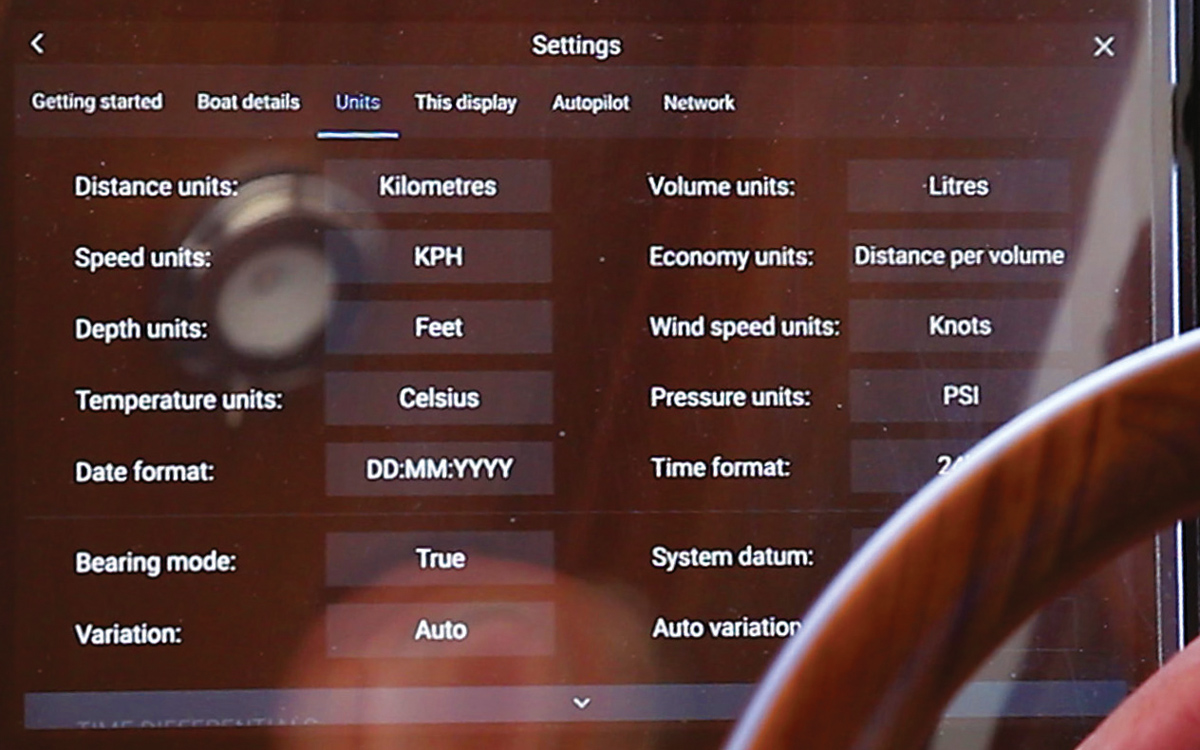
Change the units from miles into nautical miles and do the same for speed (knots) and depths (metres) so that they match your printed charts, taking particular care to use the same system datum (usually WGS 84).
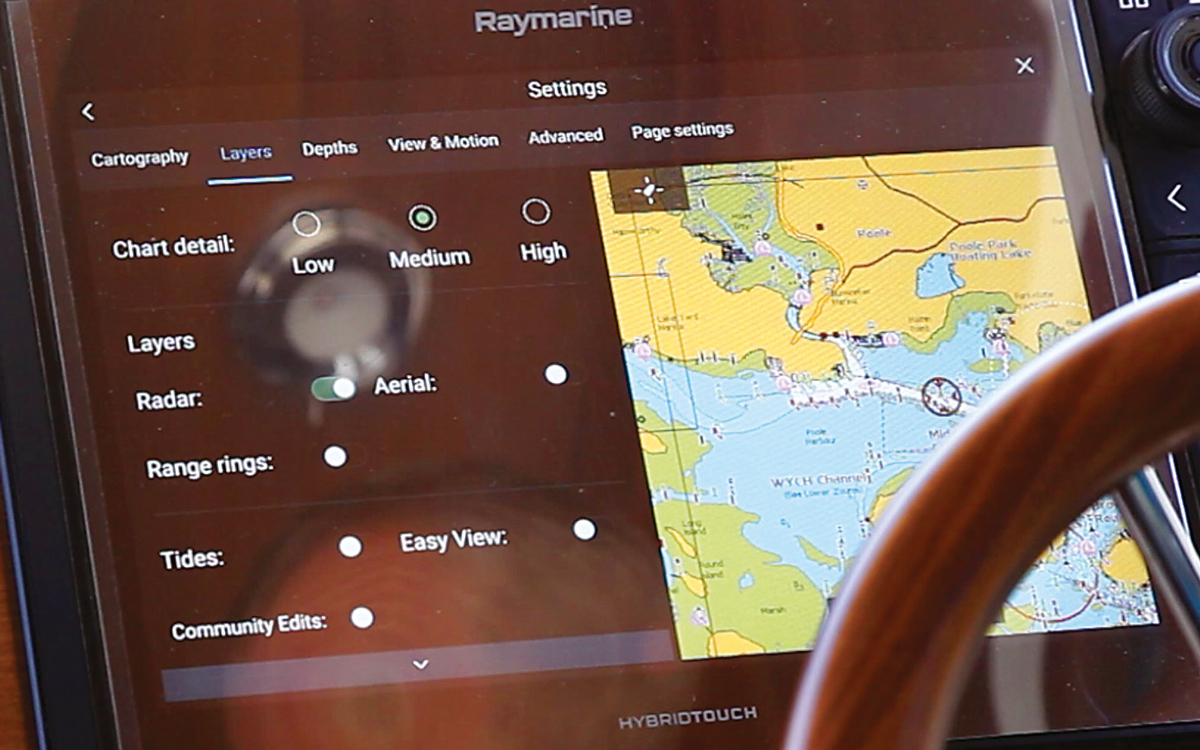
Decide how much detail you want. Some cartography displays have too much and look cluttered, while others adjust to how zoomed in you are. Choose with care what you leave out and check how zooming affects this.
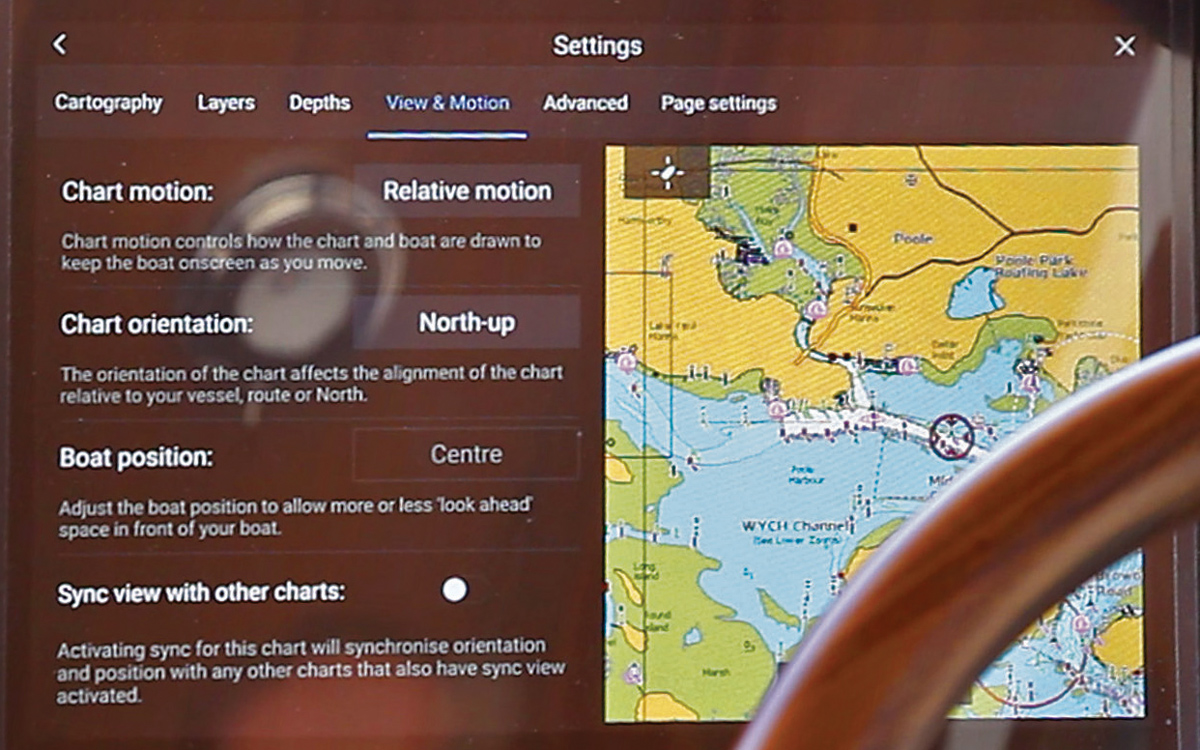
‘North up’ orientation is the best for passage and route planning, however many skippers prefer ‘Head up’ when it comes to local pilotage as the chart view matches what you are seeing ahead of your boat.
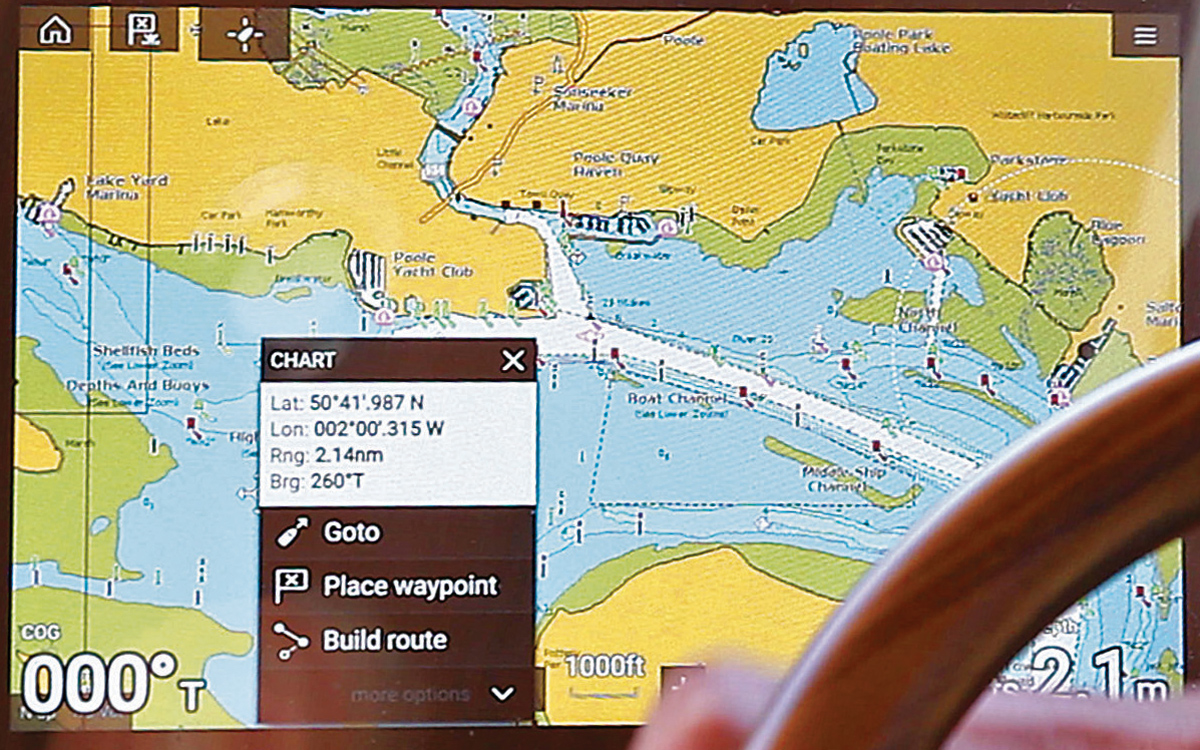
Check how the bearing and direction of the cursor are displayed. Here we can see that the cursor is on a bearing of 260T True and 2.14nm nautical miles.
Our How To video series is brought to you in association with GJW Direct.