

Once you’ve set up your chartplotter, the next step is knowing how to enter a route and using it to stay safe when underway.
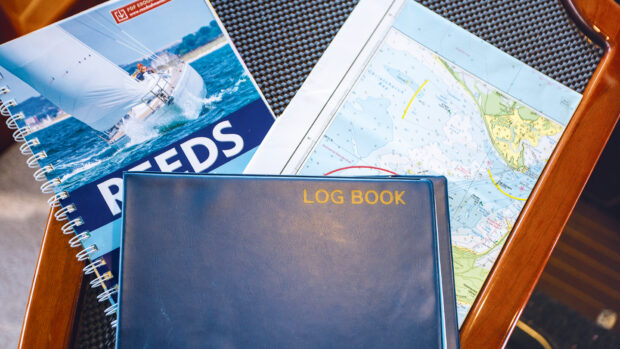
If the area is unfamiliar, I always recommend using a physical chart first to plan where you want to go. It really helps to see your entire route in one go without having to scroll or zoom, and with practice you will learn to visualise in your head where things are in relation to one another.
This helps massively when you start to enter the route into the chartplotter, especially if you have a small screen and find yourself having to zoom in and out to see the detail for each potential waypoint.
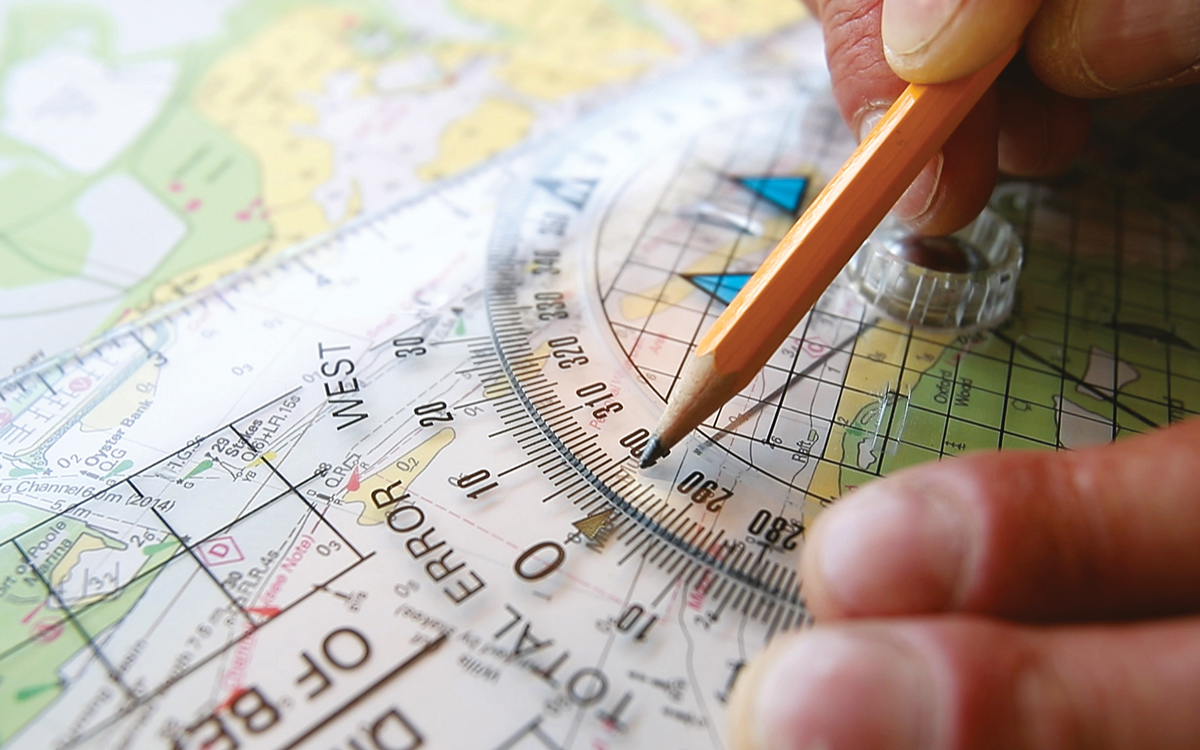
In this example I have planned a route around Poole harbour. It’s not long or complicated and can be made entirely by eyeball with local knowledge but would be quite hard if you were cruising here for the first time and didn’t know the area or its numerous navigation marks.
Shopping for an MFD? Check out YBW’s guide to the best chartplotters on the market.
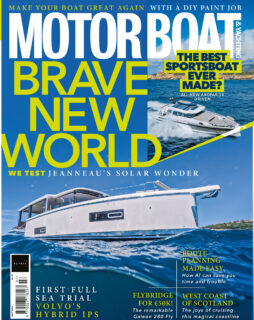
The first step is to look at the chart, decide on the route, then using a pencil and ruler mark the route from buoy to buoy or chosen position. Each change of course is called a waypoint and its position is marked using a cross with a square around it (the symbol for a waypoint).
Adding waypoints
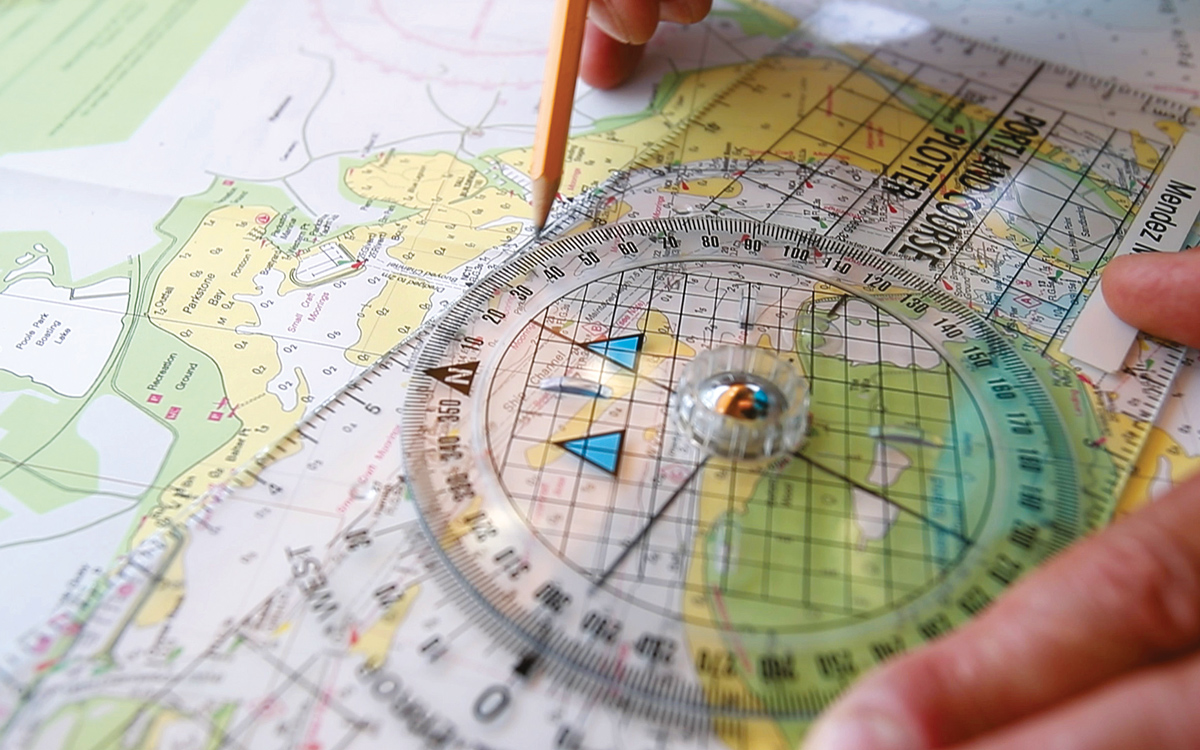
Take a bearing of each leg using a Portland plotter, then measure the distance using a set of dividers. Write this information alongside each leg on the chart. You may prefer to write all the different legs down as a list for greater clarity, but I am happy with it just on the chart.
The next step is to go to the boat’s plotter and using the ‘New Route’ feature place the cursor at your planned starting position to create the first waypoint.
Now move the cursor to the end of the first leg and press ‘add waypoint’. Repeat this for each leg until the route is complete. Don’t forget to save and name the route.
Before you run the route, it’s a good idea to compare the route information on screen with what you have written on the chart.
There will always be minor differences in bearing and distance as you are comparing pencil lines and analogue measurements with precise electronic ones and it assumes you have chosen exactly the same spot for each waypoint. However, any major differences should jump out, enabling you to correct them before setting off.
When you’re ready to run the route, choose the route from the plotter’s memory and make sure you are running it in the correct direction (most plotters give you the option of forward or reverse). As you approach the first waypoint select the route and press ‘go’.
Don’t start the route too early or it will show the bearing of the first waypoint from where you currently are, which may not have clear water in front of you. We’ll show you how it works afloat in our next video.
1. Begin plotting: Draw the first leg on the printed chart using a 2B pencil (it should be easy to rub off afterwards) and mark the start and end with the waypoint symbol.
2. Note the bearing: Rotate the plotter centre so the blue arrows align with chart North and read off the bearing of the first leg (here it is 296°T). Write this alongside the leg on your chart.
3. Note the distance: Use a set of dividers to measure the distance then take it to the scale printed on the edge of the chart to see how far it is in nautical miles. Write this on the chart too.
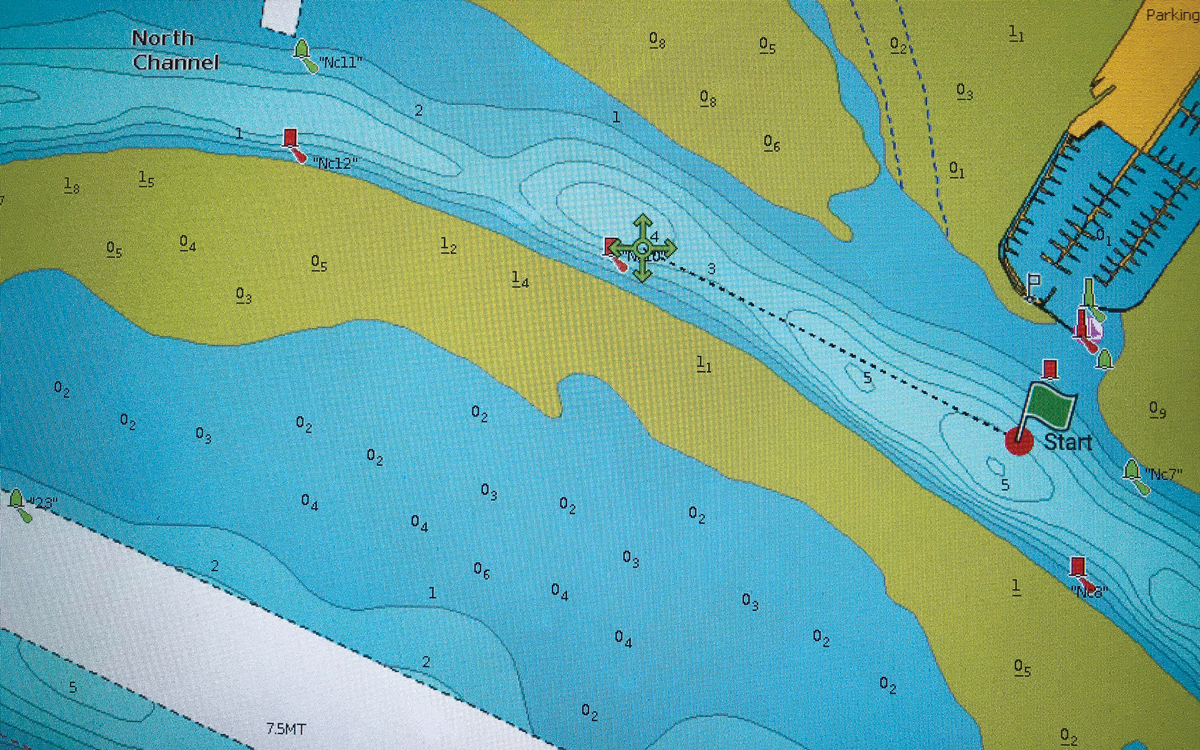
4. Transfer to the plotter: Now place your start point and each subsequent waypoint on the plotter by moving the cursor to the location and clicking on the spot. This is where referring to the printed chart really helps.
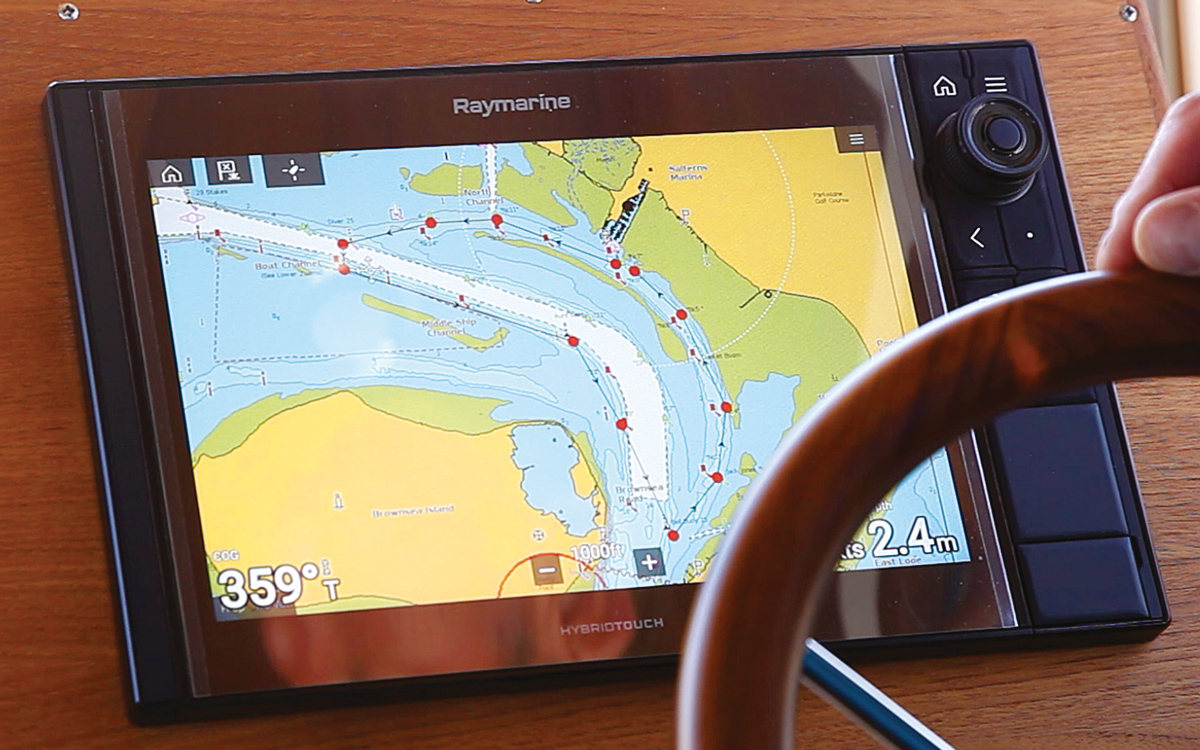
5. Route overview: This is what the completed route looks like on the plotter. The route direction can be seen from the arrows. We’ll show you how to run the route in our next video
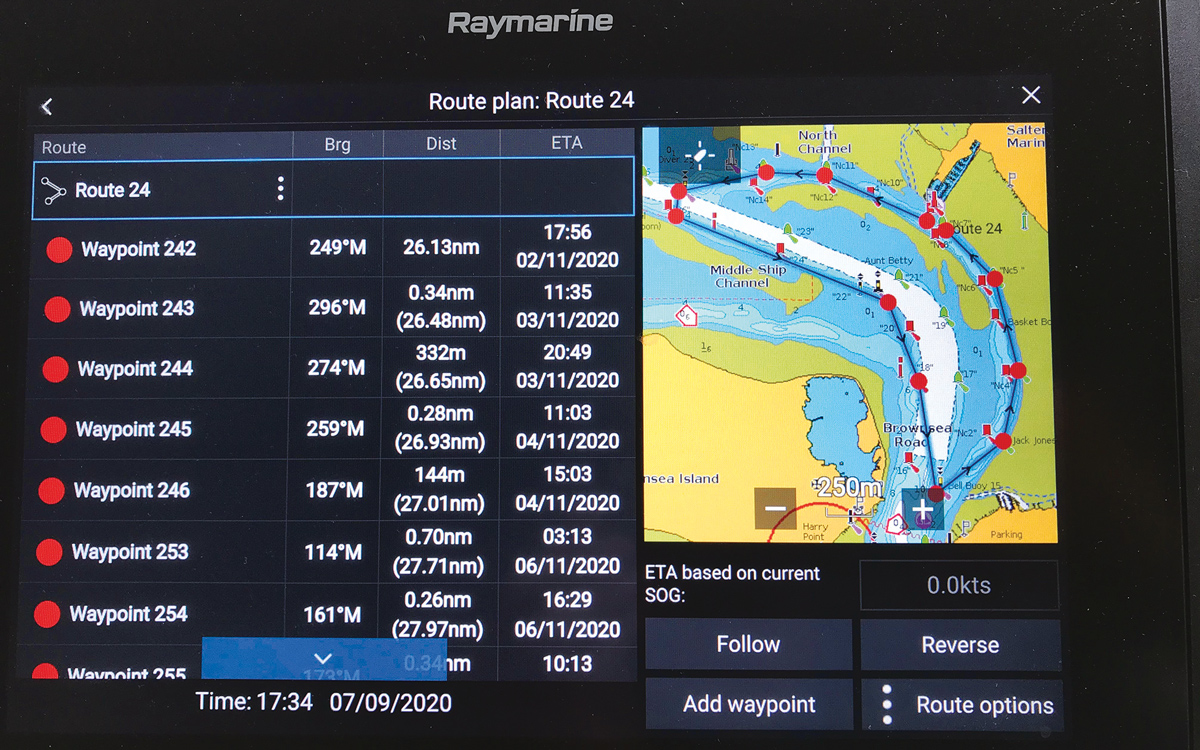
6. Compare both charts. It’s now easy to compare the chartplotter’s route list of distances and bearings with those you’ve marked on the chart. This allows you to check both sides match and the route is safe to use
Our How To video series is brought to you in association with GJW Direct.